
Building Private Cloud:
NFS Done Right
2025-12-06 15:31:47 tech Private Cloud Storage NAS NFS k8s Monitoring
(Nano Banana Pro generated) thumbnail
For some context, my previous storage solution is to have a 2T SSD attached to one node1 in the cluster, and use NFS to mount it onto the same directory of every other nodes. This way I can use hostPath k8s volume into that directory without caring about which node the pod is provisioned on.
This worked kind of OK for a while, serving the majority of my use cases with decent performance. But it has always been a suboptimal solution in my opinion for 2 main reasons:
- This seems a bit too manual. What if some node fails to mount NFS? What if every node fail to mount after a cluster reboot? Why not let k8s deal with this since I'm already running a k8s cluster?2
- I was never able to fully understand how FS permissions work with mounted NFS directories, plus how that works with a k8s container running on that host. This results in quite a few sloppy (or just frankly dangerous) cases of exposed application directories, and they become more and more uncomfortable for me.
Finally I got rid of my ego and humbly asked Claude™ for some advice, and it turns out that k8s already works with NFS-backed volumes out-of-the-box! There're 2 options with different benefits and limitations, and let's get into them one by one.
NFS Provisioner
The NFS provisioner is a deployed program in k8s, that will connect and mount volumes for each pod in need, with necessary information about your NFS server. This is the "heavier" and more managed solution, which is a good replacement for my existing solution. Here's a step-by-step guide of how to set it up.
- Make sure you have a properly configured NFS server available, if not you can follow this section to setup. Additionally you should add
no_root_squashfor all the/etc/exportsconfigs you add, e.g.
/nfs/path/to/share <node1_ip>(rw,sync,no_subtree_check,no_root_squash) <node2_ip>(rw,sync,no_subtree_check,no_root_squash) ...
- For the most boring part of k8s (Roles and Auth), Claude is very kind to generate this set of config. A specific set of permissions are given to the service account, which will be used by the NFS provisioner. Note that all these are in a separated namespace
nfs-provisioner, you can config otherwise as you wish.
k8s account/role/auth configs
apiVersion: v1
kind: ServiceAccount
metadata:
  name: nfs-client-provisioner
  namespace: nfs-provisioner
---
apiVersion: rbac.authorization.k8s.io/v1
kind: ClusterRole
metadata:
  name: nfs-client-provisioner-runner
rules:
  - apiGroups: [""]
    resources: ["nodes"]
    verbs: ["get", "list", "watch"]
  - apiGroups: [""]
    resources: ["persistentvolumes"]
    verbs: ["get", "list", "watch", "create", "delete"]
  - apiGroups: [""]
    resources: ["persistentvolumeclaims"]
    verbs: ["get", "list", "watch", "update"]
  - apiGroups: ["storage.k8s.io"]
    resources: ["storageclasses"]
    verbs: ["get", "list", "watch"]
  - apiGroups: [""]
    resources: ["events"]
    verbs: ["create", "update", "patch"]
---
apiVersion: rbac.authorization.k8s.io/v1
kind: ClusterRoleBinding
metadata:
  name: run-nfs-client-provisioner
subjects:
  - kind: ServiceAccount
    name: nfs-client-provisioner
    namespace: nfs-provisioner
roleRef:
  kind: ClusterRole
  name: nfs-client-provisioner-runner
  apiGroup: rbac.authorization.k8s.io
---
apiVersion: rbac.authorization.k8s.io/v1
kind: Role
metadata:
  name: leader-locking-nfs-client-provisioner
  namespace: nfs-provisioner
rules:
  - apiGroups: [""]
    resources: ["endpoints"]
    verbs: ["get", "list", "watch", "create", "update", "patch"]
---
apiVersion: rbac.authorization.k8s.io/v1
kind: RoleBinding
metadata:
  name: leader-locking-nfs-client-provisioner
  namespace: nfs-provisioner
subjects:
  - kind: ServiceAccount
    name: nfs-client-provisioner
    namespace: nfs-provisioner
roleRef:
  kind: Role
  name: leader-locking-nfs-client-provisioner
  apiGroup: rbac.authorization.k8s.io
- Add the NFS provisioner deployment and corresponding storage class. The logic of provisioning space (create directory), mount to pods and manage connections are all in this deployment. The storage class is used to create PVC from this provisioner, where we define a pattern for the mounted directory path for each PVC.
NFS provisioner deployment and storage class k8s config
apiVersion: apps/v1
kind: Deployment
metadata:
  name: nfs-client-provisioner
  namespace: nfs-provisioner
  labels:
    app: nfs-client-provisioner
spec:
  replicas: 1
  strategy:
    type: Recreate
  selector:
    matchLabels:
      app: nfs-client-provisioner
  template:
    metadata:
      labels:
        app: nfs-client-provisioner
    spec:
      serviceAccountName: nfs-client-provisioner
      containers:
        - name: nfs-client-provisioner
          image: registry.k8s.io/sig-storage/nfs-subdir-external-provisioner:v4.0.2
          volumeMounts:
            - name: nfs-client-root
              mountPath: /persistentvolumes
          env:
            - name: PROVISIONER_NAME
              value: nfs-storage
            - name: NFS_SERVER
              value: <nfs_server_ip>  # <- replace
            - name: NFS_PATH
              value: /path/to/root/dir  # <- replace
      volumes:
        - name: nfs-client-root
          nfs:
            server: <nfs_server_ip>  # <- replace
            path: /path/to/root/dir  # <- replace
---
apiVersion: storage.k8s.io/v1
kind: StorageClass
metadata:
  name: nfs-storage
  annotations:
    storageclass.kubernetes.io/is-default-class: "true"
provisioner: nfs-storage
parameters:
  archiveOnDelete: "false"
  pathPattern: "${.PVC.namespace}/${.PVC.name}"
- Finally we can define and use the PVC in the following way:
PVC and application deployment example k8s config
apiVersion: v1
kind: PersistentVolumeClaim
metadata:
  name: my-pvc
  namespace: default
spec:
  storageClassName: nfs-storage
  accessModes:
    - ReadWriteMany
  resources:
    limits:
      storage: 256Gi
    requests:
      storage: 64Gi
---
apiVersion: apps/v1
kind: Deployment
metadata:
  name: my-app
  ...
spec:
  ...
  template:
    spec:
      containers:
        - name: my-app
          image: ...
          ...
          volumeMounts:
            - name: app-data
              mountPath: ...
      volumes:
        - name: app-data
          persistentVolumeClaim:
            claimName: my-pvc
With the above setup as an example, the actually mounted path from the NFS host will be /path/to/root/dir/default/my-pvc. The overall directory structure will look like this:
/path/to/root/dir
├── namespace1/
│   ├── pvc-name1/
│   │   └── [your application files]
│   └── pvc-name2/
│       └── [your application files]
├── namespace2/
│   ├── app-data/
│   │   └── [your application files]
│   └── database-storage/
│       └── [your application files]
└── default/
    └── test-pvc/
        └── test.txt
As a drop-in replacement for my original solution, I still need a reliable procedure to migrate existing use cases onto the new setup. To do that, I use a k8s job like this:
k8s job to migrate an example app
kind: Deployment
apiVersion: apps/v1
metadata:
  name: app-migration
  labels:
    app: app-migration
spec:
  replicas: 1
  selector:
    matchLabels:
      app: app-migration
  template:
    metadata:
      labels:
        app: app-migration
    spec:
      containers:
        - name: app-migrationtea
          image: <same-image-as-the-original-app>
          imagePullPolicy: Always
          command: ["/bin/sh", "-c"]
          args:
          - |
            # Copy existing data from old storage to PVC
            cp -av /data_old/* /data/
            echo "migration finished"
            ls -la /data/
            sleep 300
          volumeMounts:
          - name: app-data
            mountPath: /data_old
          - name: app-pvc
            mountPath: /data
      volumes:
      - name: app-data
        hostPath:
          path: <old-path-on-host>
          type: Directory
      - name: app-pvc
        persistentVolumeClaim:
          claimName: <new-pvc-name>
This job uses the original app's container and environment, which (for simpler cases) could make sure that the files in the newly mounted PVC has correct permissions and ownerships for the original app to work. Some more complicated cases do exist, e.g. actual app may run as a different user/group than the sh user, or the app relies on some hidden files (with filenames starts with .) which might be left out by the cp command. Those cases may need to be handled manually.
NFS Volumes
Another way of using NFS in k8s is directly declaring an NFS server/path as a volume. something like this:
# in k8s config of some deployment...
spec:
  # ...
  template:
    # ...
    spec:
      containers:
      # ...
        - name: nfs-volume
          mountPath: /mnt/foo/bar
          readOnly: true # if needed
      volumes:
      - name: nfs-volume
        nfs:
          server: <server-ip>
          path: <nfs-exported-path>
          readOnly: true # if needed
Different from NFS-backed PVC where NFS connection is made by the nfs-provisioner when you create the PVC, here the connection is made when the deployment is, well deployed. It should work as long as the NFS configuration is correct and the target path does exist. As you can tell, this approach allows you to mount any existing data onto k8s jobs with great flexibility, which is particularly useful when you need to access data from external source (e.g. photos, videos managed by other softwares).
Monitoring
Since I already have the prometheus-grafana setup3, might as well try to monitor the usage for my app data.
A common caveat to note is that k8s is not actually enforcing the space limit for NFS-based PVCs. The capacity you specify in a PVC is more of a "request" than a hard limit, mostly for scheduling/matching purpose. The actual enforcement has to be done through the underlying filesystem (e.g. Quota-enabled NFS, block storage, CSI Drivers with Quota Support).
This also affects observability of space usage for NFS-based PVCs, where if you pull PVC metrics from kubelet, you'll see the same usage stats for all PVCs, which is actually reporting the underlying FS stats. To actually monitor that you'll need something like a node-exporter, and get the metrics by running du on each of the PVC folders.
I wrote a simple Python script (with the help from Claude) that can periodically check all sub directories under the NFS PVC base dir, and emit prometheus metrics as a metrics server. Note that his only works for the directory structure specified in #nfs_provisioner
nfs-pvc-exporter.py
#!/usr/bin/env python3
from prometheus_client import start_http_server, Gauge
import os
import time
import subprocess

# Prometheus metrics
pvc_used_bytes = Gauge('nfs_pvc_used_bytes', 'Used bytes per PVC', ['namespace', 'pvc_name'])

# Configuration
SCRAPE_INTERVAL = int(os.getenv('SCRAPE_INTERVAL', '60'))
NFS_BASE_PATH = os.getenv('NFS_BASE_PATH')

def get_directory_usage(path):
    try:
        # Get usage in bytes
        result = subprocess.run(
            ['du', '-sb', path],
            capture_output=True,
            text=True,
            timeout=30
        )
        if result.returncode == 0:
            usage_bytes = int(result.stdout.split()[0])
            return usage_bytes
    except Exception as e:
        print(f"Error getting usage for {path}: {e}")
    return None

def find_pvc_volumes():
    volumes = []
    if not os.path.exists(NFS_BASE_PATH):
        print(f"Kubelet pods path not found: {NFS_BASE_PATH}")
        return volumes

    # Iterate through pod directories
    for ns in os.listdir(NFS_BASE_PATH):
        ns_path = os.path.join(NFS_BASE_PATH, ns)

        if not os.path.isdir(ns_path):
            continue
        for volume in os.listdir(ns_path):
            volume_path = os.path.join(ns_path, volume)
            if not os.path.isdir(volume_path):
                continue
            volumes.append({
                'path': volume_path,
                'namespace': ns,
                'pvc_name': volume,
            })
    return volumes

def collect_metrics():
    print(f"Collecting metrics at {time.strftime('%Y-%m-%d %H:%M:%S')}")

    volumes = find_pvc_volumes()
    print(f"Found {len(volumes)} PVC volumes")

    for vol in volumes:
        path = vol['path']
        namespace = vol['namespace']
        pvc_name = vol['pvc_name']
        print(f"  Checking {namespace}/{pvc_name} at {path}")

        used = get_directory_usage(path)
        if used is not None:
            pvc_used_bytes.labels(namespace=namespace, pvc_name=pvc_name).set(used)
            print(f"    Used: {used / (1024**3):.2f} GB")

def main():
    # Start Prometheus metrics server
    port = int(os.getenv('METRICS_PORT', '9101'))
    start_http_server(port)
    print(f"Metrics server started on port {port}")
    print(f"Scraping every {SCRAPE_INTERVAL} seconds")

    # Collect metrics periodically
    while True:
        try:
            collect_metrics()
        except Exception as e:
            print(f"Error collecting metrics: {e}")
        time.sleep(SCRAPE_INTERVAL)

if __name__ == '__main__':
    main()
This script should be deployed with a k8s deployment and corresponding service. Then in prometheus config add a job in the scrape configs:
# ...
scrape_configs:
  - job_name: 'nfs-pvc-exporter'
    kubernetes_sd_configs:
      - role: pod
        namespaces:
          names:
            - monitoring
    relabel_configs:
      - source_labels: [__meta_kubernetes_pod_label_app]
        action: keep
        regex: nfs-pvc-exporter
Then the metric should be available in prometheus and grafana with name nfs_pvc_used_bytes, and you can build dashboards from it.
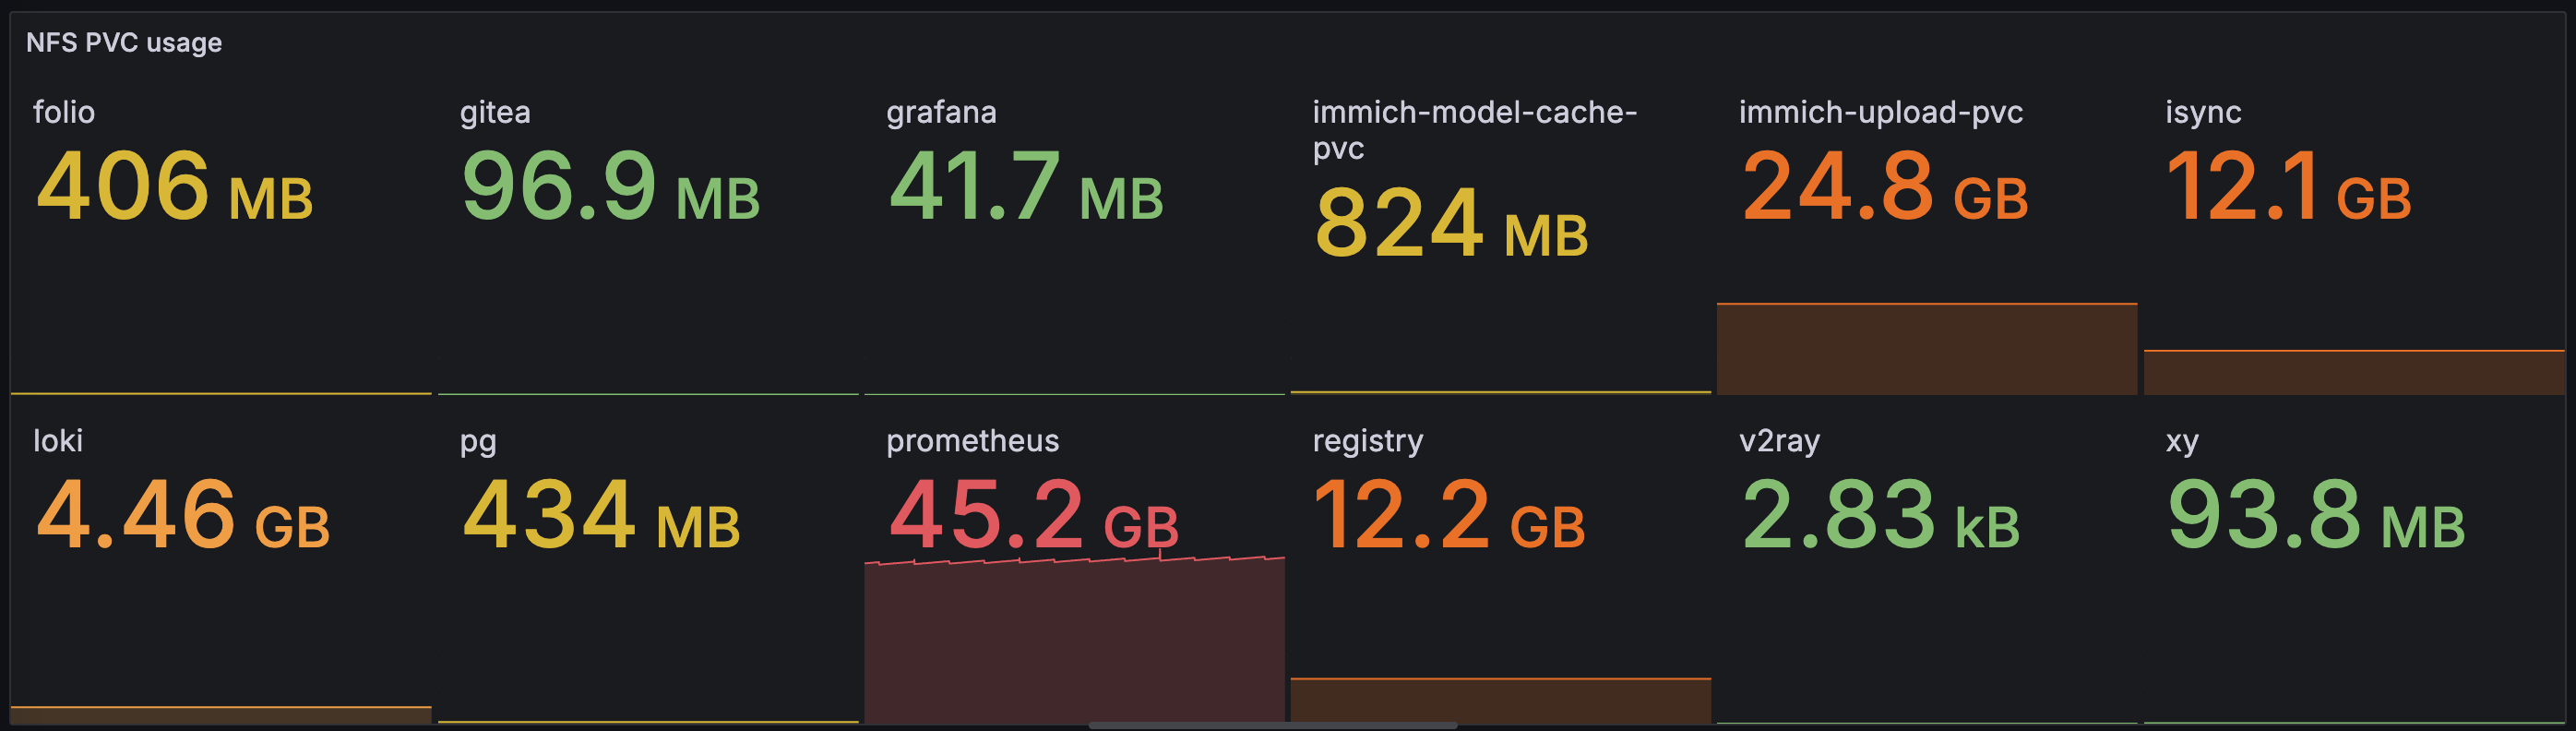
Dashboard with simple usage report
With some pretty obvious clues from the dashboard, you might have guessed that we'll talk about how to use this new storage paradigm to seamlessly import and manage photo and video content with self-hosted Immich service. So until next time, happy hacking :)